SpectrumView

Key Features
- Real-time spectrogram and spectrum analyzer with configurable sample rates from 8 kHz to 48 kHz and adjustable FFT resolution
- Tap data cursor displays exact frequency (Hz), level (dBFS), and cent-accurate musical note notation at any point on the display
- Seven selectable color scales and multiple window functions for customizing the visual analysis to suit different tasks
- Audio recording in uncompressed WAV format with playback and live spectrogram overlay for reviewing captured audio
- Logarithmic and linear frequency scale options for switching between octave-based musical analysis and linear scientific views
- Peak hold mode freezes up to three frequency envelope snapshots in distinct colors for comparison over time
- CSV data snapshot export for analyzing spectrogram and spectrum data in Excel, MATLAB, or other scientific software
Description
SpectrumView turns your iPhone or iPad into a real-time spectrum analyzer and spectrogram. Developed by Oxford Wave Research, it captures audio through the device microphone or an external input and displays frequency content as a color-coded spectrogram or a traditional amplitude-versus-frequency graph.
The app supports sample rates from 8,000 Hz up to 48,000 Hz, covering frequencies well beyond the range of human hearing. Configurable FFT window lengths let you balance time resolution against frequency resolution depending on the analysis task.
Tapping anywhere on the spectrogram or spectrum analyzer display reveals the exact frequency in Hertz and level in decibels at that point. A musical note mode converts tapped frequencies into cent-accurate pitch notation, making it useful for tuning instruments or analyzing vocal pitch.
Recordings save in uncompressed WAV format and can be played back with the spectrogram or spectrum analyzer overlaid for review. Files transfer via email, iTunes file sharing, or SoundCloud upload.
The free version includes full spectrogram and spectrum analyzer functionality with all sample rates and FFT options. In-app purchases unlock logarithmic frequency scaling, peak hold overlays, pinch-to-zoom in the frequency domain, unlimited recording length, and data snapshot CSV export for use in Excel or MATLAB.
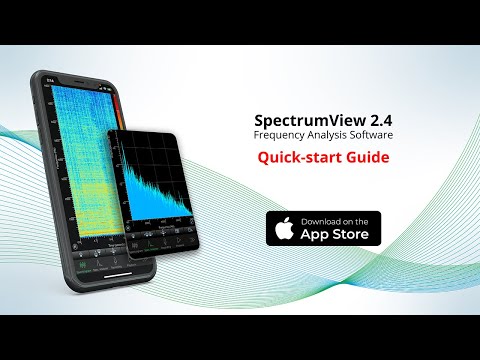
Video Preview
Frequently Asked Questions
Can I use my phone as a spectrum analyzer?
Yes. SpectrumView turns an iPhone or iPad into a real-time spectrum analyzer using the built-in microphone. It supports sample rates up to 48,000 Hz and provides both spectrogram and spectrum analyzer views with tap-to-read frequency and level data.
Is SpectrumView free or does it cost money?
The core app is free with full spectrogram, spectrum analyzer, recording, and playback functionality. Optional in-app purchases ($0.99 to $1.99 each) unlock features like logarithmic scaling, peak hold, pinch-to-zoom, unlimited recording, and data export.
What is the difference between a spectrogram and a spectrum analyzer?
A spectrogram shows frequency content over time as a scrolling color map, where color intensity represents amplitude. A spectrum analyzer shows a single snapshot of amplitude versus frequency at the current moment. SpectrumView provides both views and you can switch between them with a tap.
Does SpectrumView work with external microphones?
Yes. SpectrumView supports audio input from external microphones connected via the Lightning or USB-C port, headphone jack adapters, or Bluetooth. External microphones typically provide more accurate measurements than the built-in device microphone.
Is there a free audio spectrum analyzer software for PC?
SpectrumView is iOS-only. For PC and Mac, Voxengo SPAN is a widely used free spectrum analyzer plugin that works in any DAW. Other options include Blue Cat's FreqAnalyst and the web-based Academo spectrum analyzer for quick browser-based analysis.


